Show code cell content
import mmf_setup; mmf_setup.nbinit()
import os
from pathlib import Path
FIG_DIR = Path(mmf_setup.ROOT) / '../Docs/_build/figures/'
os.makedirs(FIG_DIR, exist_ok=True)
import logging; logging.getLogger("matplotlib").setLevel(logging.CRITICAL)
%matplotlib inline
import numpy as np, matplotlib.pyplot as plt
try: from myst_nb import glue
except: glue = None
This cell adds /home/docs/checkouts/readthedocs.org/user_builds/iscimath-583-fractals/checkouts/latest/src to your path, and contains some definitions for equations and some CSS for styling the notebook. If things look a bit strange, please try the following:
- Choose "Trust Notebook" from the "File" menu.
- Re-execute this cell.
- Reload the notebook.
Sound#
Self-similarity can produce some interesting auditory effects. For example, in Chapter 3, [Schroeder, 1991] discusses sounds based on Weierstrass functions which behave in a counter-intuitive way: The waveform in Fig. 12 for example has the property that doubling the frequency leads to the same pitch.
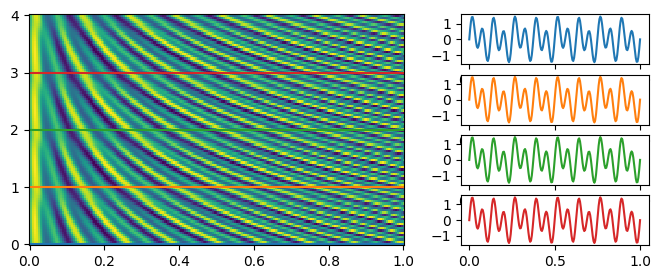
Related is the Shepard tone which consists of a series of notes separated by octaves such that the lowest and highest notes are outside of the threshold of hearing. As the pitch is continually increased, the lowest note enters the auditory range while the highest note leaves, resulting in exactly the same perceived tone after continually increasing for an entire octave:
from matplotlib.gridspec import GridSpec

f_min = 1
f_max = 32

def envelope(f, f_min=f_min, f_max=f_max, alpha=1.0):
    """Return a smooth (C_infinity) envelope function between `f_min` and `f_max`."""
    x = 2*(f - f_min)/(f_max - f_min) - 1
    with np.errstate(over='ignore'):
        return np.where(
            np.logical_or(f<=f_min, f>=f_max),
            0,
            1/np.cosh(alpha*np.tan(x*np.pi/2)))

#f = np.linspace(0, 110)
#plt.plot(f, envelope(f))
fs = 2**np.arange(np.floor(np.log2(f_min)) - 4,
                  np.ceil(np.log2(f_max)) + 4)
def f(t, fs=fs):
    A = envelope(fs[..., None])
    w = 2*np.pi * fs[..., None]
    return (A * np.sin(w*t)).sum(axis=0)

ts = np.linspace(0, 1/f_min, 203)
Noctave = 4
octaves = np.linspace(0, Noctave, 102)
As = f(ts, (2**octaves)[None, :] * fs[:, None])
#plt.plot(ts, f(ts, fs))
#plt.plot(ts, f(ts, 2fs))
fig = plt.figure(figsize=(8, 3))
gs = GridSpec(Noctave, 2, width_ratios=(2, 1))
ax0 = fig.add_subplot(gs[:, 0])
ax0.pcolormesh(ts, octaves, As)
for n in range(Noctave):
    ax0.axhline(n, ls='-', c=f'C{n}')
    ax = fig.add_subplot(gs[n, 1])
    A = f(ts, 2**n * fs)
    ax.plot(ts, A, f'-C{n}')