Show code cell content
import mmf_setup; mmf_setup.nbinit()
import os
from pathlib import Path
FIG_DIR = Path(mmf_setup.ROOT) / '../Docs/_build/figures/'
os.makedirs(FIG_DIR, exist_ok=True)
import logging; logging.getLogger("matplotlib").setLevel(logging.CRITICAL)
%matplotlib inline
import numpy as np, matplotlib.pyplot as plt
try: from myst_nb import glue
except: glue = None
This cell adds /home/docs/checkouts/readthedocs.org/user_builds/iscimath-583-fractals/checkouts/latest/src to your path, and contains some definitions for equations and some CSS for styling the notebook. If things look a bit strange, please try the following:
- Choose "Trust Notebook" from the "File" menu.
- Re-execute this cell.
- Reload the notebook.
Galton and Darwin#
In More Food for Fair Thought in Chapter 6 of [Schroeder, 1991], Schroeder discusses an experiment in which Charles Darwin was trying to see if there was a difference between the growth of self-fertilized and cross-fertilized plants. He provided his half-cousin, Francis Galton, 30 measurements of the heights of plants, 15 of each type. Galton performed a rank-order comparison, concluding: “We may…confidently affirm that a crossed series will always be found to exceed a self-fertilised series, within the range of the conditions under which the present experiment has been made.”
Discuss the validity of Galton’s claim. Support your answer by proposing a model and simulating with a random number generator. Compare your results with the bootstrap method mentioned by Schroeder.
The Growth of Zea Mays#
The growth is for a species of corn (Zea mays). The following table is from Darwin’s Notes. Heights are in inches.
Pot 1: Crossed |
Self-fert. |
Pot 2 Crossed |
Self-fert. |
Pot 3 Crossed |
Self-fert. |
Pot 4 Crossed |
Self-fert. |
|---|---|---|---|---|---|---|---|
23 4/8 |
17 3/8 |
22 |
20 |
22 1/8 |
18 5/8 |
21 |
18 |
12 |
20 3/8 |
19 1/8 |
18 3/8 |
20 1/8 |
15 2/8 |
22 1/8 |
12 6/8 |
21 |
20 |
21 4/8 |
18 5/8 |
18 2/8 |
16 4/8 |
23 |
15 4/8 |
21 5/8 |
18 |
12 |
18 |
||||
23 2/8 |
16 2/8 |
I have examined the measurements of the plants with care, and by many statistical methods, to find out how far the means of the several sets represent constant realities, such as would come out the same so long as the general conditions of growth remained unaltered. The principal methods that were adopted are easily explained by selecting one of the shorter series of plants, say of Zea mays, for an example.”
The observations as I received them are shown in columns II. and III., where they certainly have no primâ facie appearance of regularity. But as soon as we arrange them the in order of their magnitudes, as in columns IV. and V., the case is materially altered. We now see, with few exceptions, that the largest plant on the crossed side in each pot exceeds the largest plant on the self-fertilised side, that the second exceeds the second, the third the third, and so on. Out of the fifteen cases in the table, there are only two exceptions to this rule. We may therefore confidently affirm that a crossed series will always be found to exceed a self-fertilised series, within the range of the conditions under which the present experiment has been made.
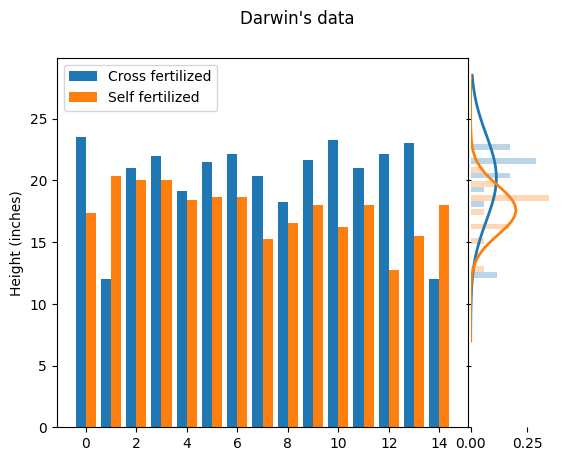
Here is a rudimentary analysis of the data: I plot the heights, then compute the mean and standard deviation (assuming a normal distribution, shown on the right axis).
h = height_inches = np.array(
    [[23+4/8, 17+3/8],
     [12, 20+3/8],
     [21, 20],
     [22, 20],
     [19+1/8, 18+3/8],
     [21 + 4/8, 18 + 5/8],
     [22 + 1/8, 18 + 5/8],
     [20 + 3/8, 15 + 2/8],
     [18 + 2/8, 16 + 4/8],
     [21 + 5/8, 18],
     [23 + 2/8, 16 + 2/8],
     [21, 18],
     [22 + 1/8, 12 + 6/8],
     [23, 15 + 4/8],
     [12, 18]])

import scipy as sp

def plot(data, extend=5):
    N = len(data)
    fig, axs = plt.subplots(
        1, 2, sharey=True,
        gridspec_kw=dict(width_ratios=(1, 0.2),
                         wspace=0.01))


    ax = axs[0]
    ax.bar(np.arange(N)-0.2, data[:, 0], width=0.4, label="Cross fertilized");
    ax.bar(np.arange(N)+0.2, data[:, 1], width=0.4, label="Self fertilized");
    ax.set(ylabel="Height (inches)")
    ax.legend(loc='upper left')

    ax = axs[1]
    ax.set(frame_on=False)
    ax.hist(data, orientation='horizontal', density=True, alpha=0.3)
    ys = np.linspace(data.min()-extend, data.max()+extend)
    dists = [sp.stats.norm(loc=m, scale=s)
             for m, s in zip(data.mean(axis=0), data.std(axis=0))]
    for n, dist in enumerate(dists):
        ax.plot(dist.pdf(ys), ys, c=f"C{n}", lw=2)

plot(height_inches)
plt.suptitle("Darwin's data")

from uncertainties import ufloat
H = [ufloat(m, s) for m, s in zip(h.mean(axis=0), h.std(axis=0))]
print(f"Crossed: h={H[0]:s}in, Self-fertilized: h={H[1]:s}in")
Crossed: h=20.2+/-3.5in, Self-fertilized: h=17.6+/-2.0in
Galton sorted the data (rank order) and then compared each rank-ordered pair.
# Rank order all the data
inds = np.argsort(h, axis=0)
sorted_height_inches = np.concatenate([[h[i]] for i, h in zip(inds.T, h.T)]).T
plot(sorted_height_inches)
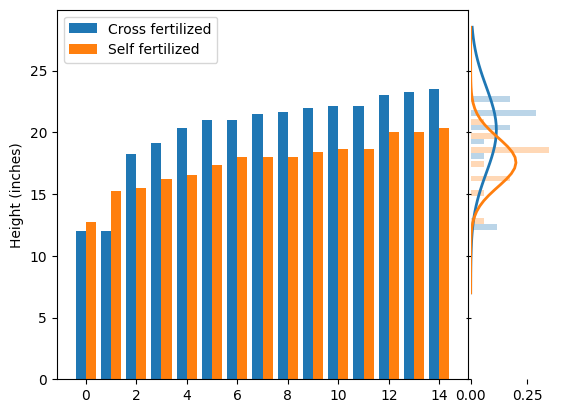
After seeing that 13 of the cross-fertilized plants were taller after rank ordering, Galton “confidently affirm[ed] that a crossed series will always be found to exceed a self-fertilised series” for the conditions realized in Darwin’s experiment? Are you convinced?
Show code cell content
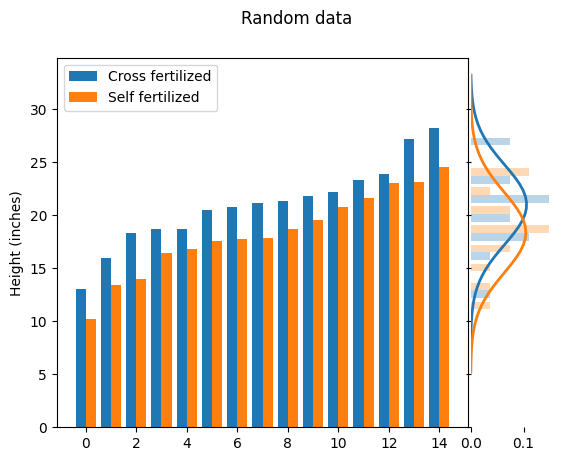
# I am not convinced...
rng = np.random.default_rng(seed=2)
N = 15
h = 20 + 4 * rng.normal(size=(N, 2))
inds = np.argsort(h, axis=0)
sorted_h = np.concatenate([[h[i]] for i, h in zip(inds.T, h.T)]).T
plot(sorted_h)
plt.suptitle("Random data");
Show code cell content
rng = np.random.default_rng(seed=2)
N = 15
h = 20 + 4 * rng.normal(size=(N, 2))
inds = np.argsort(h, axis=0)
sorted_h = np.concatenate([[h[i]] for i, h in zip(inds.T, h.T)]).T
plot(sorted_h)
plt.suptitle("Random data");
References#
https://arxiv.org/abs/2102.02572