Show code cell content
import mmf_setup; mmf_setup.nbinit()
import os
from pathlib import Path
import logging; logging.getLogger("matplotlib").setLevel(logging.CRITICAL)
%matplotlib inline
import numpy as np, matplotlib.pyplot as plt
This cell adds /home/docs/checkouts/readthedocs.org/user_builds/iscimath-583-fractals/checkouts/latest/src to your path, and contains some definitions for equations and some CSS for styling the notebook. If things look a bit strange, please try the following:
- Choose "Trust Notebook" from the "File" menu.
- Re-execute this cell.
- Reload the notebook.
Assignment 1: Darwin and Galton#
Review Galton and Darwin and the accompanying text in More Food for Fair Thought in Chapter 6 of [Schroeder, 1991]. Do you agree with Sir Galton’s rather strong claim about Darwin’s data based on the fact that 13 of the 15 ranked comparisons favored the crossed series?
Suggestions:
Try randomly generating some data. How unlikely are Darwin’s results if there is no difference between the datasets?
Your result will likely depend on your assumptions about how the plant heights are distributed. Choose something reasonable give the data.
Another approach is based on Bootstrapping where you simply sample the actual data (with replacements).
Code Examples#
Here is some code to help you get started:
import numpy as np

rng = np.random.default_rng(seed=2024)   # Always use an explicit seed!

# Randomly generate 30 = 15x2 heights uniformly distributed between 10 and 20
h = 10 + 10*rng.random(size=(15, 2))
print(f"mean h={h.ravel().mean():2g}+-{h.ravel().std():.2g}")

# Randomly generate 30 = 15x2 heights uniformly normally about 10 with std 2
h = rng.normal(loc=20, scale=2, size=(15, 2))
print(f"mean h={h.ravel().mean():.2g}+-{h.ravel().std():.2g}")

# Rank order all the data. There is some transposing here to keep everything in the
# correct shape. I do this by guess and check...
inds = np.argsort(h, axis=0)
sorted_h = np.concatenate([[h[i]] for i, h in zip(inds.T, h.T)]).T

# Here is how you might bootstrap the data
bootstrap_h = rng.choice(h.ravel(), size=(15, 2))
mean h=14.2245+-2.8
mean h=20+-1.9
I recommend that you write a function like that in Galton and Darwin to analyze and plot your data. Then you can give this different data to analyze. Here we simply redo Galton’s analysis and see how well it works.
def get_h(N=15, delta=0, rng=rng):
"""Return heights.
Arguments
---------
N : int
Number of samples. `shape=(N, 2)`
delta : float
Difference in mean heigh between samples.
"""
h = rng.random(size=(N, 2))
return h + np.array([delta, 0])[None, :]
def galton(h):
"""Return the number of cases where the first rank-orderd column is bigger."""
inds = np.argsort(h, axis=0)
sorted_h = np.concatenate([[h[i]] for i, h in zip(inds.T, h.T)]).T
assert np.all(np.diff(sorted_h, axis=0) >= 0)
N = (np.diff(sorted_h, axis=1) > 0).sum()
return N
# Reinitialize rng for reproducible results!
rng = np.random.default_rng(seed=2024)
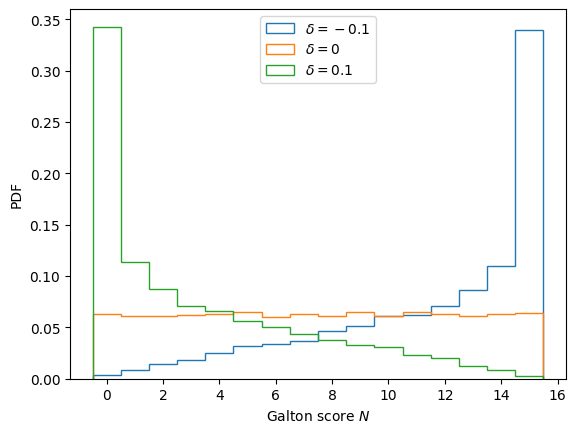
Nsamples = 20000
N = 15
fig, ax = plt.subplots()
for delta in [-0.1, 0, 0.1]:
Ns = [galton(get_h(N=N, delta=delta, rng=rng)) for n in range(Nsamples)]
ax.hist(Ns,
bins=np.arange(N+2)-0.5, # Make sure our bins are centered
density=True, # Normalize to probabilities (PDF)
histtype='step', # Don't fill the bars
label=fr"$\delta={delta}$")
ax.legend()
ax.set(xlabel="Galton score $N$", ylabel="PDF");
Random Numbers#
You can generate random numbers like plant heights using NumPy’s random number generators. The following might be useful:
numpy.random.default_rng(): Provides a variety of ways of generating random numbers including:numpy.random.Generator.random(): Uniform numbers in \([0, 1)\).numpy.random.Generator.normal(): Normally distributed numbers with meanlocand standard deviationsize.numpy.random.Generator.choice(): Choose samples withreplace=Trueto implement Bootstrapping.
Always use a seed!
You should always give it a seed so you can reproduce your results later.
Histograms#
To explore your distributions you can use the matplotlib.pyplot.hist() function
from Matplotlib.