Show code cell content
import mmf_setup; mmf_setup.nbinit()
import os
from pathlib import Path
import logging; logging.getLogger("matplotlib").setLevel(logging.CRITICAL)
%matplotlib inline
import numpy as np, matplotlib.pyplot as plt
This cell adds /home/docs/checkouts/readthedocs.org/user_builds/iscimath-583-fractals/checkouts/latest/src to your path, and contains some definitions for equations and some CSS for styling the notebook. If things look a bit strange, please try the following:
- Choose "Trust Notebook" from the "File" menu.
- Re-execute this cell.
- Reload the notebook.
Cantor Set#
A couple of interesting properties of the Cantor set \(C\) from A Corner of Cantor’s Paradise in Chapter 7 of [Schroeder, 1991]:
Cantor’s set can be through of as all numbers in base 3 of the form \(0.2020220\bar{2}\) with no digits \(1\). To make this unique, do not allow any number to contain a 1 followed by repeated zeros or 2s: I.e. write \(0.1\bar{0} = 0.0\bar{2}\) and \(0.1\bar{2} = 0.2\). This makes the trinary representations unique.
All numbers in \([0,2]\) can be expressed as the sum \(a+b\) of two numbers from \(a, b \in C\).
The endpoints of the excluded intervals are in \(C\), but there are other points like \(1/4\in C\) that are not boundary points. Nevertheless, there are no intervals or interior points. Hint: \(1/4 = 0.\overline{02}\).
from itertools import product
Ndigits = 2
for digits in product(*([('0', '2')]*Ndigits)):
print(''.join(digits))
def get_cantor(N):
"""Return elements of the Cantor set.
Arguments
---------
N : int
Return all ternary fractions with N digits in the Cantor set.
"""
q = 1/(3**np.arange(1, N+1))
digits = [[0, 2],]*(N-1) + [[0, 1, 2]]
cs = [sum(d*q) for d in product(*digits)] + [1]
return cs
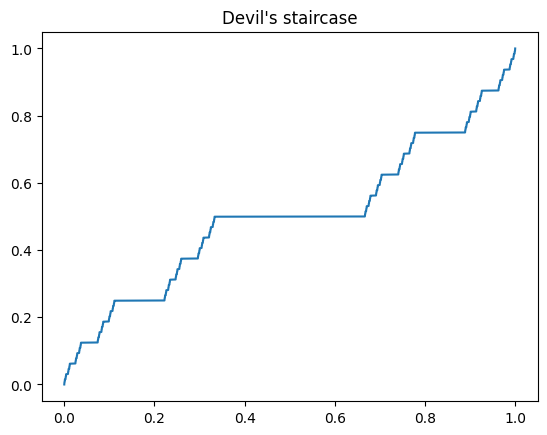
c = get_cantor(10)
x = np.linspace(0, 1, len(c))
fig, ax = plt.subplots()
ax.plot(c, x)
ax.set(title="Devil's staircase");
00
02
20
22
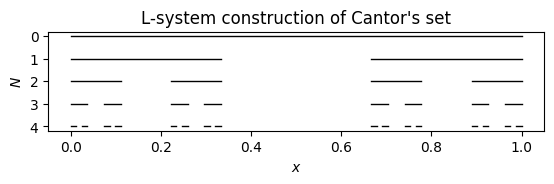
Cantor’s set can also be constructed by removing the middle third of each interval, which can be expressed as an l-system (see L-Systems).
Show code cell source
from math_583 import turtle

l = turtle.Lindenmayer(axom='F', f='fff', F='FfF')
print(l)

fig, ax = plt.subplots()
Ns = np.arange(5)
ys = -0.05*Ns

for y, N in zip(ys, Ns):
    l.draw(N, z0=1j*y, dz0=1/3**N, ax=ax, lw=1)


ax.set(xlabel='$x$', ylabel='$N$',
       title="L-system construction of Cantor's set",
       yticks=ys, yticklabels=Ns);
Lindenmayer(delta=90, axiom='F', axom='F', f='fff', F='FfF')
Numbers in Different Bases#
As mentioned above, the Cantor set can be expressed simply in terms of trinary proper fractions without the digit 1. Several other interesting fractals can be computed by expressing numbers in specific bases:
The Cantor set can be expressed as the set of proper fractions in base \(\beta = 3\) that can be expressed with the digits \(0\) and \(2\) (no digits \(1\)). (See Cantor Set.)
The twindragon can be expressed as the set of all proper fractions in base \(\beta=1-\I\) (see Twindragon.)
Variations on these can be explored: i.e. by changing the base \(\beta\). What does the set of proper fractions in base \(\beta = 4\) without the digit \(1\) look like? What about the proper fractions in base \(\beta=2-\I\)?
Write the following two functions, then generate some of these fractals and use your dimension-extracting code to compute a fractal dimension for these sets.
Details#
Consider writing a number \(\cdots d_{2}d_{1}d_{0}.d_{-1}d_{-2}d_{-3}d_{-4}\cdots\) in base \(\beta\)
We assume for simplicity that \(d_{n} \in D \subseteq \{0, 1, 2, \dots, 9\}\), then we can easily write the number in base \(\beta\) as a string.
Do It! Write the following function
def base2d(numstr, base):
    """Return the decimal equivalent of `numstr` in the specified `base`.

    >>> base2d('12.347862', base=10)
    12.347862
    """
Solution
The first is quite easy to code. The only trick is ensuring we produce the correct powers \(n\) for each digit.
def base2d(numstr, base):
    """Return the decimal equivalent of `numstr` in the specified `base`.

    >>> base2d('12.347862', base=10)
    12.347862
    """
    head, tail = numstr, ''
    if '.' in numstr:
        head, tail = numstr.split('.')
    digits = np.array(list(head+tail), dtype=int)
    n = len(head) - np.arange(len(head+tail)) - 1.0
    return (digits * base ** n).sum()
Show code cell content
def base2d(numstr, base):
    """Return the decimal equivalent of `numstr` in the specified `base`.

    >>> base2d('12.347862', base=10)
    12.347862
    """
    head, tail = numstr, ''
    if '.' in numstr:
        head, tail = numstr.split('.')
    digits = np.array(list(head+tail), dtype=int)
    n = len(head) - np.arange(len(head+tail)) - 1.0
    return (digits * base ** n).sum()

def d2base(d, base, max_digits=100):
    """Return the string representation of `d` in the specified `base`.

    Arguments
    ---------
    d : float
        Floating point number in base 10 to convert.
    base : complex
        Desired base
    max_digits : int
        Maximum digits to return (in case of fractions).

    >>> d2base(12.347862, base=10)
    '12.347862'
    """
Now “count” in these bases and generate points in these two sets:
Box Counting Dimension#
Here we demonstrate the box-counting dimension using numpy.histogram(). This is
explored in Assignment 2: Box Counting.
fig, ax = plt.subplots()

for Nbins, label, fmt in [
        (np.arange(3, 200), "", 'C0-.'),
        (2**np.arange(1, 9), r"$N_{\text{bins}} = 2^{n}$", 'C1-o'),
        (3**np.arange(1, 6), r"$N_{\text{bins}} = 3^{n}$", 'C2-s')]:
    dxs = []
    Nboxes = []
    for N in Nbins:
        dxs.append(1/N)
        Nboxes.append(sum(np.histogram(c, bins=N, range=(0, 1))[0] > 0))
    dxs, Nboxes = map(np.array, (dxs, Nboxes))
    ax.loglog(1/dxs, Nboxes, fmt, label=label)

ax.legend()

dim = np.log(2)/np.log(3)
ax.plot(1/dxs, 1/dxs**(dim), ':k')
ax.plot(1/dxs, 2.5/dxs**(dim), ':k')
ax.set(aspect=1, xlabel=r"$1/\epsilon$", ylabel=r"$N(\epsilon)$",
       title="Box-counting dimension (slope) " +
             r"$\lim_{\epsilon\rightarrow 0}\; \log N(\epsilon)/\log (1/\epsilon)$.");
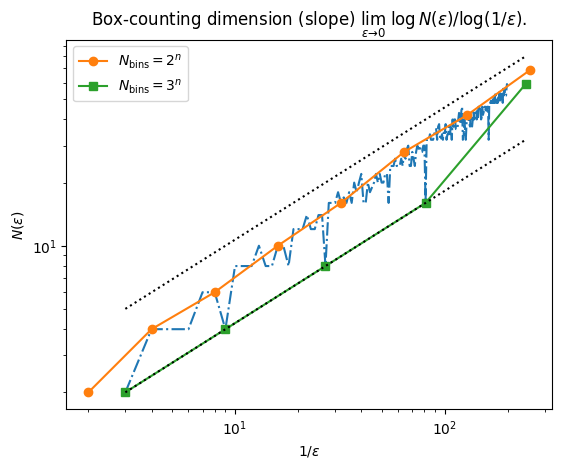
Notice that the fluctuations are quite large, but this partly because we are plotting boxes that are not nested. If one considers only boxes with \(N=3^n\) or similar which nest, the fluctuations are generally much smaller. (I suspect that the last green point is due to round-off error with points exactly at the bin boundaries for \(N_{\text{bins}} = 3^{n}\).)
The dashed black lines correspond to theoretical Hausdorff dimension \(d = \log{2}/\log{3}\) for the Cantor set \(C\) with different prefactors to guide the eye.